Broadcast - 15 February 2026
So what were you doing yesterday……. But sixty years ago?
Can you remember waking up on the 14th February 1966 to a brand-new currency, assuming you were in Australia? Pounds, shillings and pence to dollars and cents, I am not sure about the effect on amateur radio equipment prices, but the one thing I remember was I didn't get as many Musk Sticks as I thought I should have for one cent! A small moment in history - but a big one for the nation.
Last clubroom Tech night, Lionel VK7ZLB, continued the NTARC’s tradition of “Test and Measurement” with a presentation on: “The unseen variations between Radio Frequency connectors and adaptors.”
RF connectors may look the same or similar, but testing quickly reveals how differently they may behave, especially at higher frequencies. Key measurements include return loss, insertion loss, impedance stability, and mechanical repeatability. Precision connectors such as N‑type and SMA are designed to maintain a consistent 50‑ohm impedance and low VSWR across wide bandwidths. Time‑domain reflectometry exposes discontinuities, while vector network analysis quantifies performance under real RF load. So even though they may “visually” look the same, as evident from Lionel’s selection of samples on the table, connector choice directly affects system efficiency, noise performance, and overall signal integrity in RF equipment.
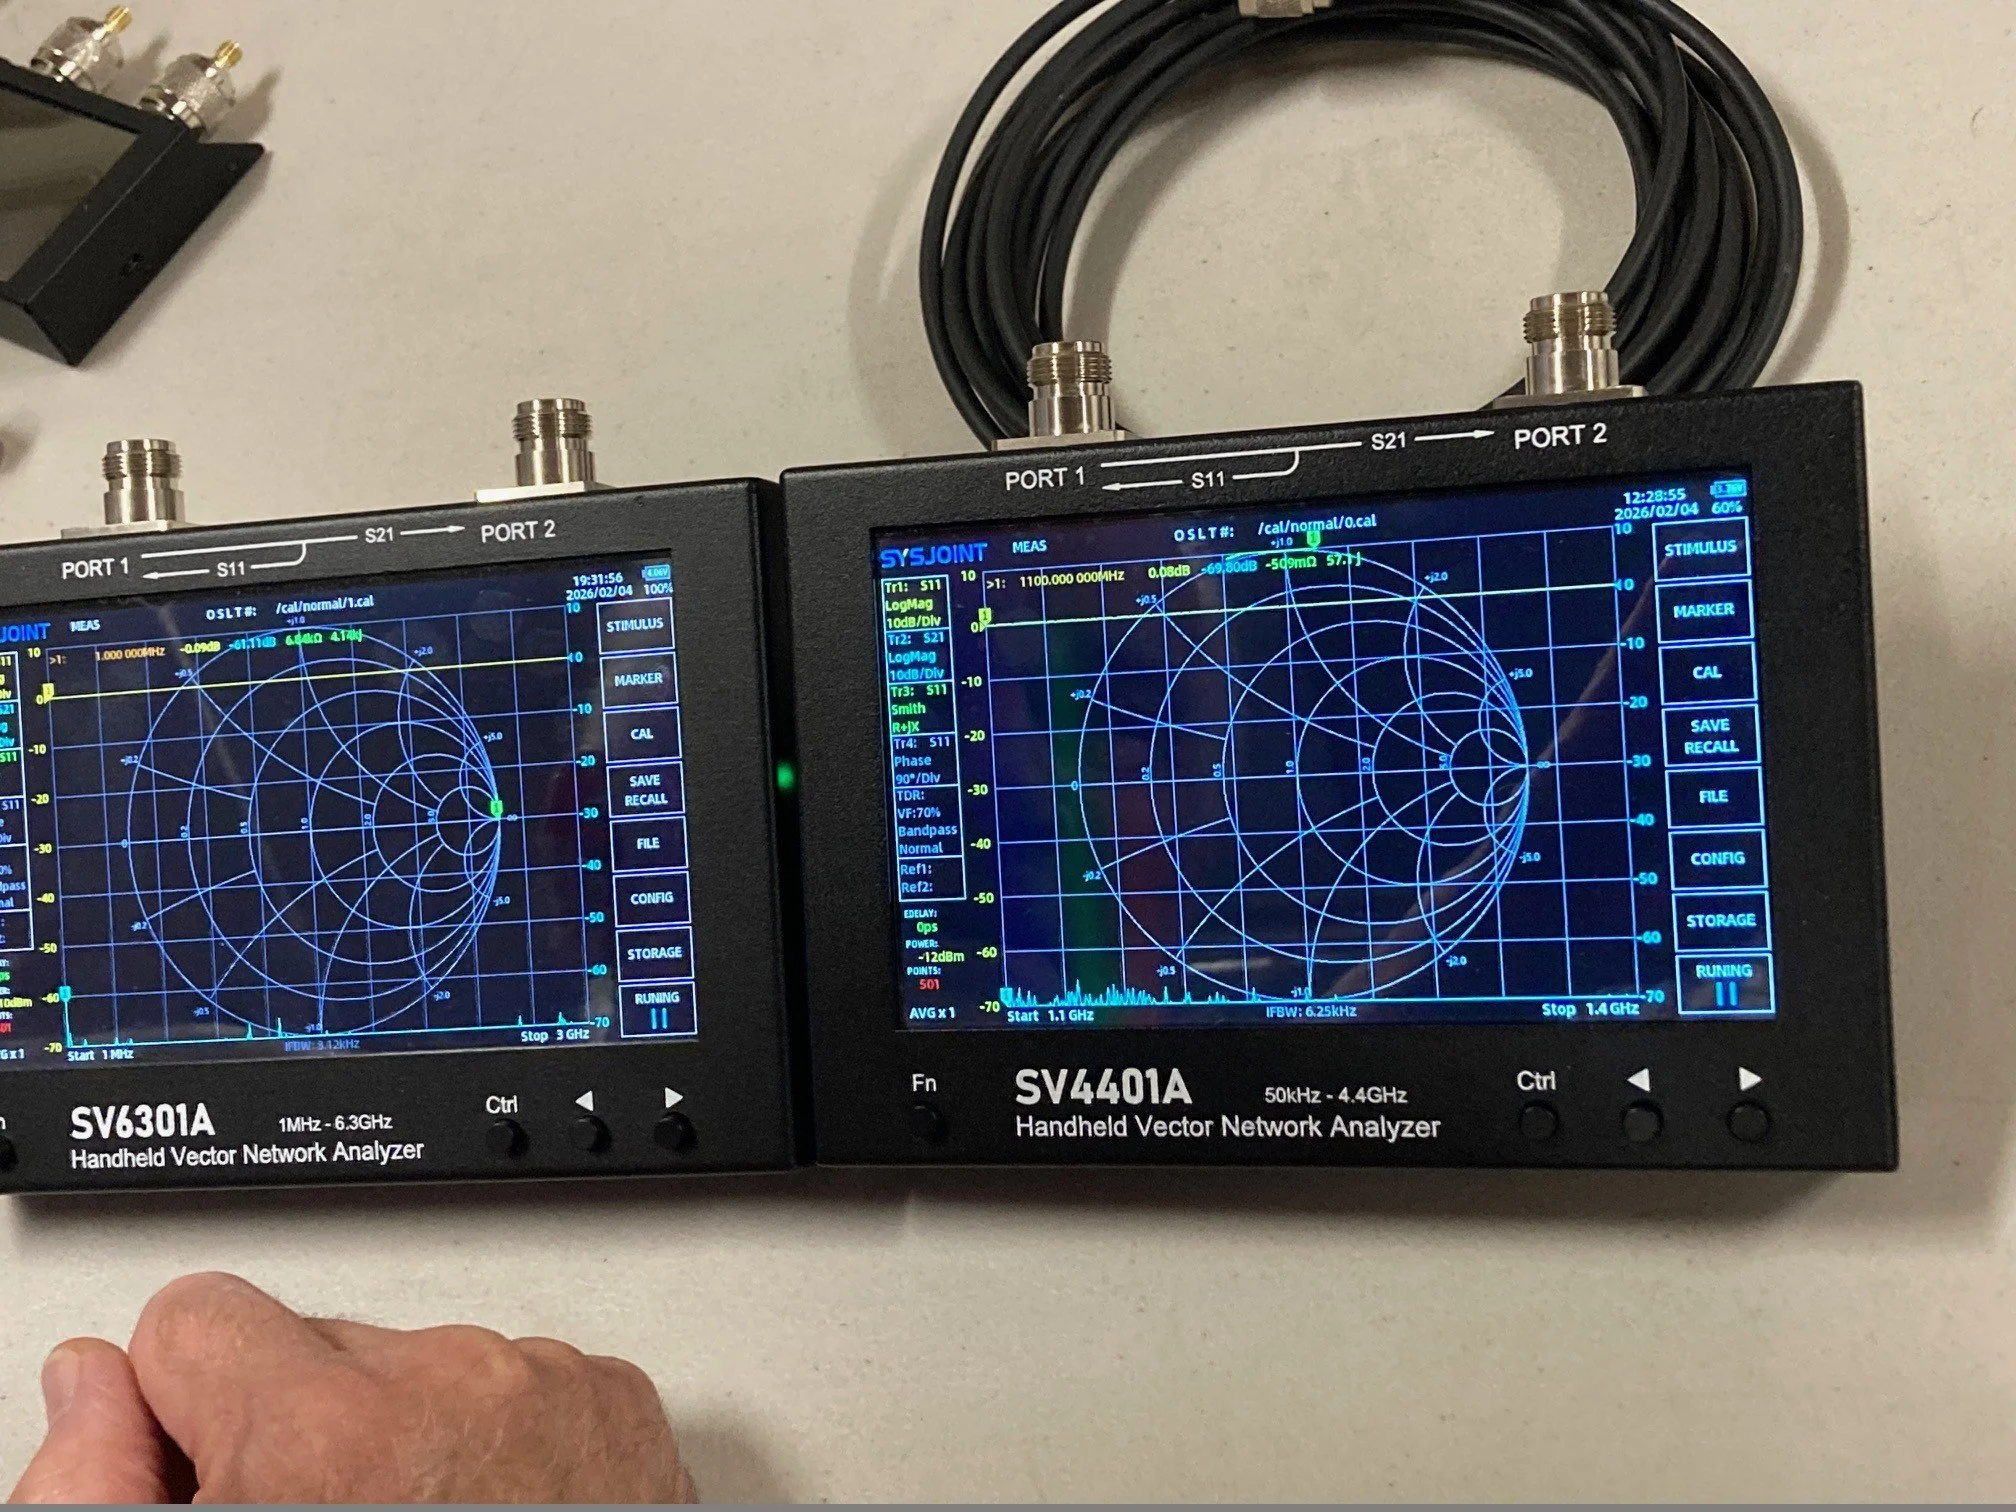
The demonstrations took place on a pair of SYSJOINT, Handheld Network Vector Analysers, one a SV4401A and the other a SV6301A, usable to 4.4 GHz and 6.3 GHz respectively. Lionel conducted testing up to 3 GHz.
Any mismatch that may be caused by wonky or misaligned geometry, dielectric variation, or poor assemble can introduce reflections that appear as bumps in return‑loss plots and Smith Charts.
Precision or industry sourced connectors seem to maintain a stable 50‑ohm profile, but cheaper online soured types were showing impedance ripple that limits wideband operation. As frequency rises, even minor deviations become electrically significant.
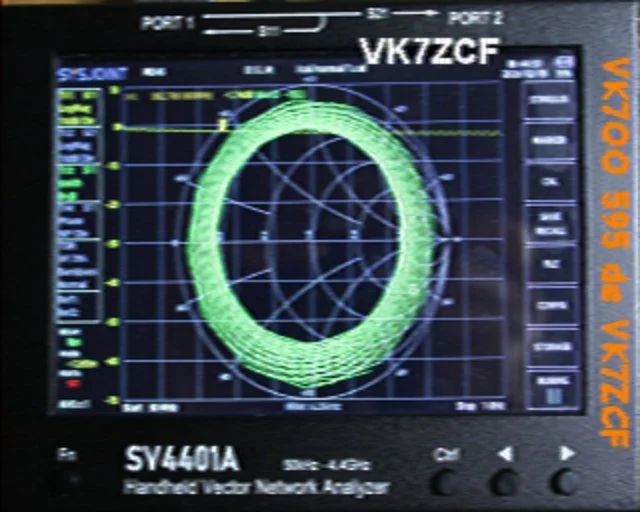
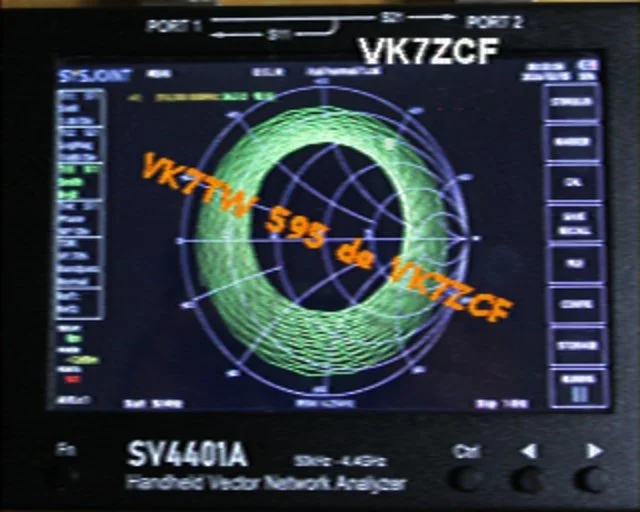
Lionel also connected up a drum of co-axial cable with the far end left open circuit. This is effectively a plot of all the impedances from short to open circuit as you sweep through the wavelength multiples. The circular display closes in as the frequency increases and the attenuation becomes dominant over time.
Have a look at the resulting Smith Chart plot on the NTARC website under Blogs for this broadcast.
Hopefully this demonstration will be returned to, once we can effectively show the instrument displays, plots and charts on the club room main display monitor.
Now for something unexpected from Lionel’s test equipment. The signal generator side of his VNA, when switched off, continues to sweep the band but at full output level regardless of previous attenuation setting. i.e. maximum level! Not ideal if you happen to be connected to the input of sensitive equipment or a power amplifier with an antenna. Lionel has loaded the latest firm-ware revision, but still has the same problem. He’s already been in touch with the distributor, and it’s starting to look like this may be an ongoing problem rather than a one‑off glitch.
UPCOMING EVENTS
On Air Test and Technical Net session - Every Wednesday night, Test-Net and CW course on 3.580 MHz from 7 pm, then a Technical Net on 3.567 MHz from 7.30 pm till 8.30 pm. Your host for the evening is Nic, VK7WW.
Club Room Technical night - The next session will be Wednesday the 18th February and will commence at the usual time of 6.30 pm at the Club Room Archer Street, Rocherlea.
Coffee Morning - Held every Friday in the NTARC Club rooms. Time is from 10 am to noon.
Finally - If you have any items of news please email them to the Secretary at the following address news@ntarc.net all items to be received no later than 5 pm on the Friday prior to the Broadcast.
That’s all folks,
73, Stefan VK7ZSB.